Study
Data-driven analysis and visualization
Poker Scientist stands out from the competition for a number of reasons. First and foremost, our solver produces the most accurate gameplan solutions in the world, with a Nash-Distance between 0.01 - 0.15% pot per hand. This level of accuracy allows us to distinguish the origin of all frequencies for strategies between 'balancing' and 'rounding-error'.
Range vs. Range
All the information you need in one single sheet.
With the Range versus Range view, you can easily navigate through the spot using action buttons and visualize the strategies of each player with a matrix.
Range matrix
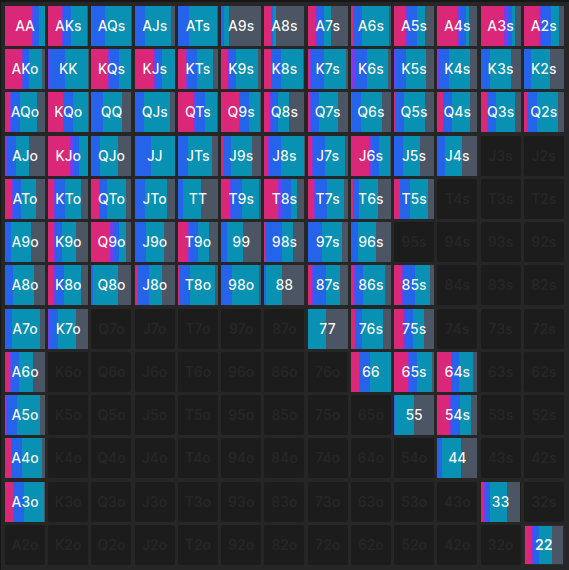
The Range Matrix feature offers a complete overview of all possible preflop card combinations that a player can hold, displayed in a matrix format along with the corresponding strategy frequencies and expected values (EVs) for each hand combination.
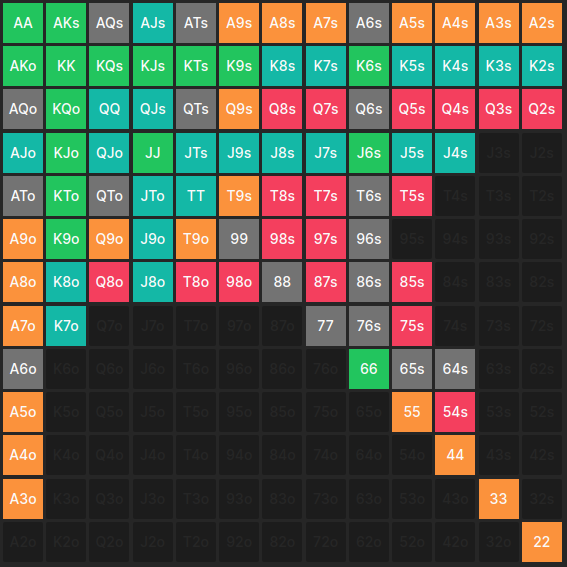
Switch between Equity and EV view
With the Range Matrix feature, you can easily switch between two different visualization modes. The first mode displays the strategy frequencies of the possible preflop card combinations, while the second mode shows the expected value (EV) in both numerical and color-coded formats, providing you with comprehensive insights to help improve your poker game.
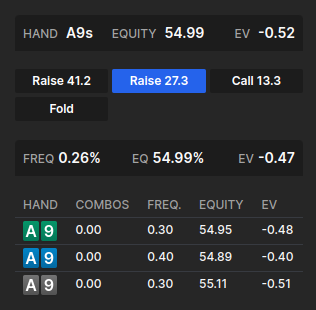
Hand details view
The Hand Details view feature allows you to view specific details of a preflop hand combination within a hand combination group. You can see the expected value (EV) and frequency of each possible action for that particular hand combination.
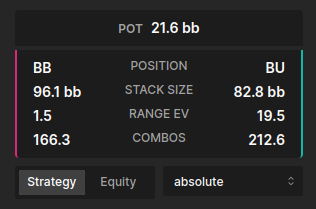
Player comparison
With the Player Comparison feature, you can directly compare the expected value (EV), hand combinations, and pot sizes of two players side by side. This allows for a quick and easy analysis of how each player's range and decisions are affecting the overall outcome of the game.
Range normalization
Customize the weight for each hand combination.
The normalization changes the color space for each cell in the matrix, and it's proportional to the weight and frequency of each cell.
Normalized
Think about a river situation where the weight for a hand is low due to all the other potential outcomes. With the relative view, it can be difficult to gather any meaningful information from the matrix.
That's why we offer the option to change the view to normalized. It provides a clearer picture of the hands in the ranges.
Absolute
But what if you still need more insight? No problem. The 'Absolute' function gives you an even more in-depth view of the strategy for every possible hand. The space of each cell is described by the normalization feature, following the mathematical description. This allows you to make informed decisions and play your best game.
Simplifier
Simplify your gameplan.
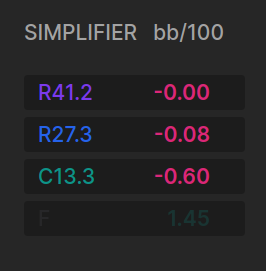
The Simplifier tool allows you to manipulate the GTO-Strategies by adding or removing actions, which has a direct impact on the measured Range-EV.
Algorithm
Our Simplification algorithm manipulates the Gameplan in a way that minimizes EV loss when removing an action, or maximizes EV gain when adding an action.
This algorithm goes beyond the Nash algorithm, allowing for strategies that are not necessarily balanced. When you remove an action, the hands that would have used that action will be directed to the alternative action with the second highest EV instead.
Simplification made easy
To see how it works, let's consider a Raw GTO-Strategy:Removing the raising actions is a good way to simplify, even if the R 17.4 has a frequency of 14.5%. If we remove the raising actions, the new strategy will only have a fold/- and a callpart, and we will not lose any relevant Range-EV.
However, if we remove a further action, our Range-EV will decrease significantly. On the other hand, if we go back to the Raw GTO-Strategy and directly remove the callnode, keeping the raise actions possible, we will only lose 2bb/100 with this strategy.
The Simplifier algorithm shows you how to take advantage of several options for simplifying your GTO-Gameplan.
Join now:
Unleash your potential!
Runout clustering
Reduce the number of different strategies.
Simplifying your strategy leads to fewer mistakes and an increase in your win rate. That's why we created the Runout Clustering feature.
The clustering process
On average, there are 6900 action nodes for a 2-Bet spot, with over 16 million possible strategies. With every scenario, there's a chance to make a mistake that could reduce your win rate. That's why it's crucial to keep your game plan as simple as possible.
We've simplified the game plan by comparing each runout with every other runout. Each runout has a specific strategy, defined by the frequency of possible moves, weighted by a parameter that represents the relative value of different lines.
For example, an all-in frequency gap is weighted higher than a frequency gap for a check.
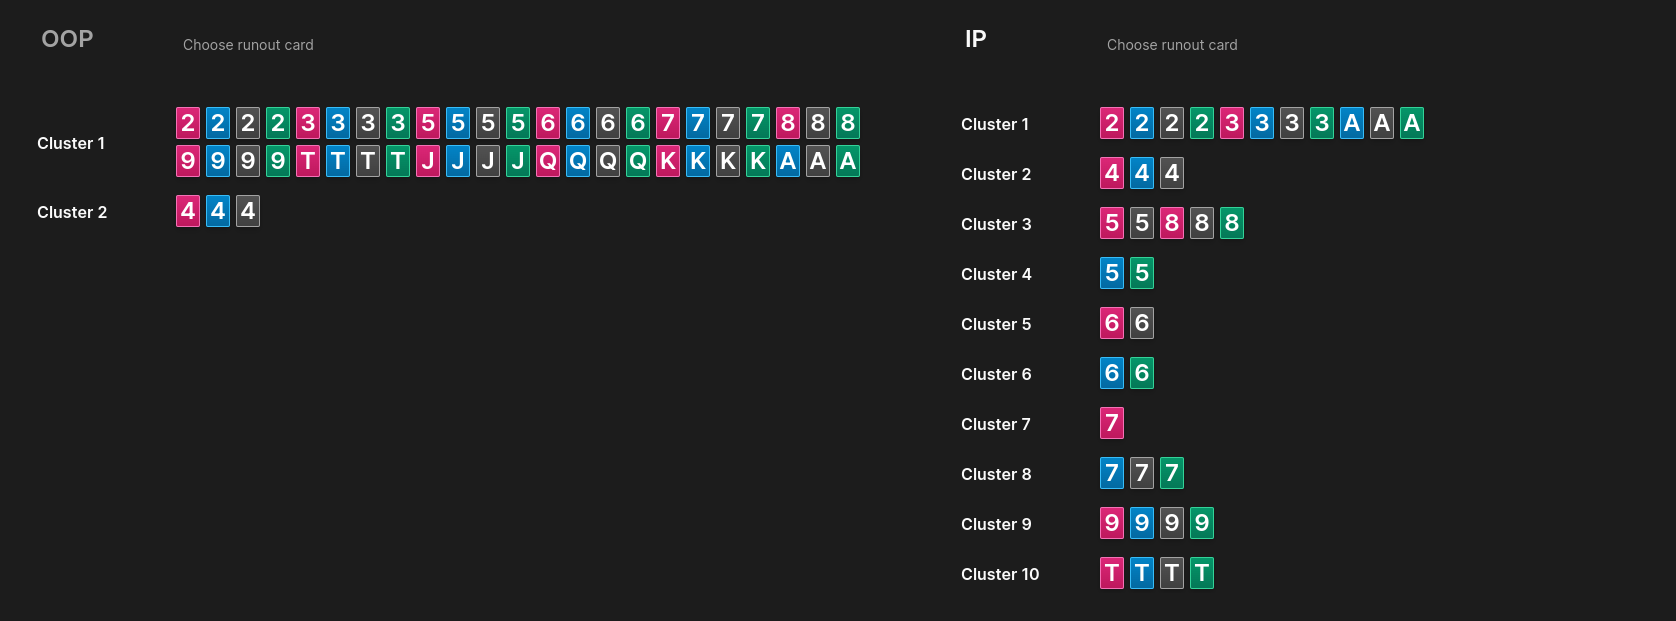
We used a 2-dimensional clustering method to find the minimum number of different clusters, without losing Range-EV for any player. The result is that the 49 turn runouts become grouped or clustered. Each cluster has a representative card with the smallest strategy difference between all cards in the cluster.
Levels of simplification
Each player has their own Runout Clustering, which is likely to be different from the other players in the same situation. Here are three examples of different levels of simplification:
High-Level simplification
In a Cashgame 3Bet MPvsBU, the strategy for BU simplifies from 49 to 2 different strategies on turn without any EV loss. (96% simplified)
Medium-Level simplification
In an MTT 25bb SRP BUvsBB, the strategy for BU simplifies from 49 to 12 different strategies on the river (75% simplified)
Low-Level simplification
In a Cashgame 2Bet BUvsBB, the strategy for BB simplifies from 49 to 21 strategies on turn (57% simplified)
It's interesting to note that you can have the same strategy for two different cards in a cluster, even though they have a big difference in their Runout-EVs. This shows that there can be multiple, different reasons for having a particular strategy.
We save the result of each Runout Clustering calculation on our backend, so you only have to calculate it once. Understanding the different cluster structures opens up a new door to understanding poker.
Made-hand distribution
A hand category overview.
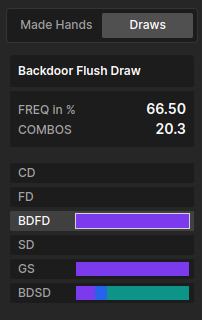
The Made-Hand distribution feature classifies hands into 18 groups and helps improve game strategy by showing the frequency of hand groups in specific actions and the likelihood of having a specific hand class in the current range.
Hand properties
Here's how it works: like mentioned the Made-Hand Distribution classifies hands into 18 different groups based on their properties. The properties of a hand are related to the board structure and can have a big impact on your strategy. With this feature, you'll be able to see the relationship between the perfect strategy for a specific spot and the hand class, like having a flush draw or set.
With this feature, you'll be able to see the relationship between the perfect strategy for a specific spot and the hand class, like having a flush draw or set.
Distribution types
And it gets even better - the feature provides two different distributions: one that shows how often a hand group results in a specific action, visualized by the color of the hand class bar, and another that shows how likely it is for you to have a specific hand class in your current range.
With the Made-Hand Distribution, you'll have all the information you need to understand which type of hand class you have in a certain action, and how likely it is.
Runout distribution graph
A comprehensive analysis of runouts.
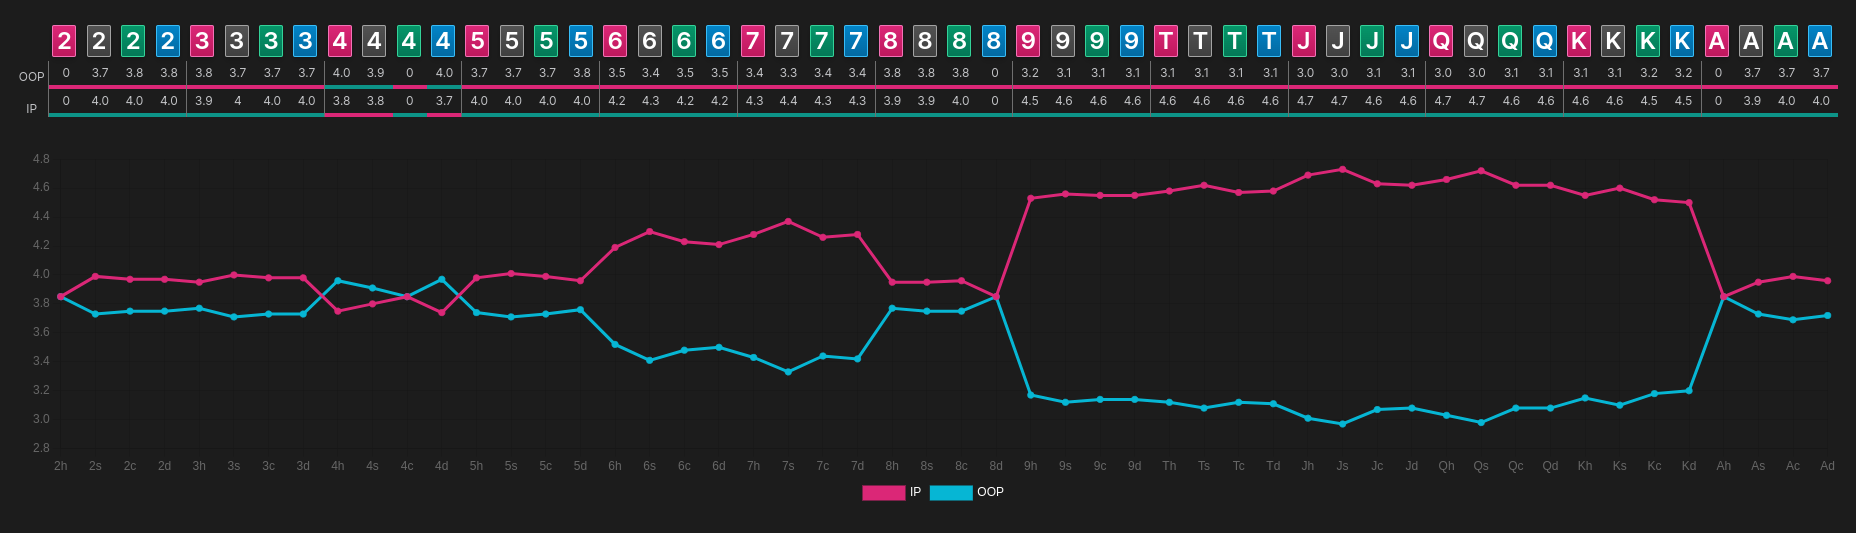
With the Runout-Distribution feature, you can easily see the impact of the runout on your range or your opponent's range, measured by expected value (EV) using a table and graph.
The graphs
The two graphs are anti-symmetric, allowing you to quickly get a full understanding of the game at a glance.
For example, if the runout is a spade, a minimum in the graph for the in-position player might indicate that they have fewer flush draws than the out-of-position player. This information is essential for making informed decisions on the next street.
Macro analysis
The big picture.
The Macro-Analysis feature gives you an overview of values like Range-EV, strategy, EQ, EQ-Realization and more for all flops of a pre-selected spot.
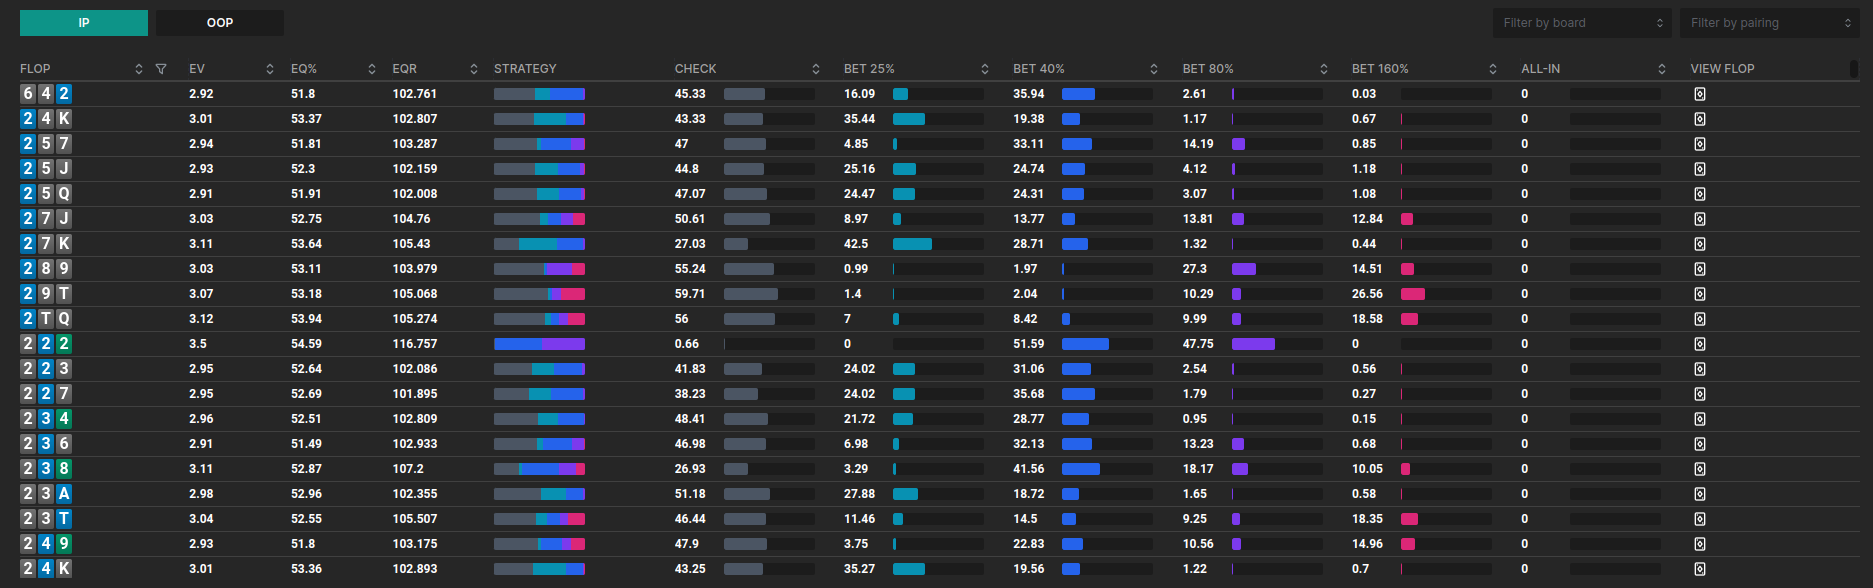
Filters
This enables you to compare strategies for different flops. It comes with two filter functions, suitedness and pairing. You can order any value from high to low or vice versa, making it easy to determine the best or worst flops for you. The average values are displayed at the top of the table.
Get the ultimate overview
With this feature, you can easily find out things like: on which type of flops you should use a big bet or check back most of the time, which flops connect well with your range or your opponent's range, and how the Range-EV is connected to your preferred strategy.